9.0 KiB
Object Detection
Image classification models we have dealt with so far took an image and produced categorical result, such as the class number. However, in many cases we do not want just to know that an object is on the picture - we want to be able to determine its location. This is exactly the point of object detection.

Image from YOLO v2 web site
Naive Approach to Object Detection
A very naive approach to object detection would be the following. If we want to find a cat on the picture, we can break the picture down to a number of tiles, and run image classification on each tile. Those tiles that result in sufficiently high activation can be considered to contain the object in question.

Image from Exercise Notebook
However, this approach is far from ideal, because it allows to locate the object's bounding box very imprecisely. For more precise location, we need to run some sort of regression to predict coordinates of bounding boxes - and for that, we need specific datasets.
Regression for Object Detection
To unders
This blog post has a great gentle introduction to detecting shapes.
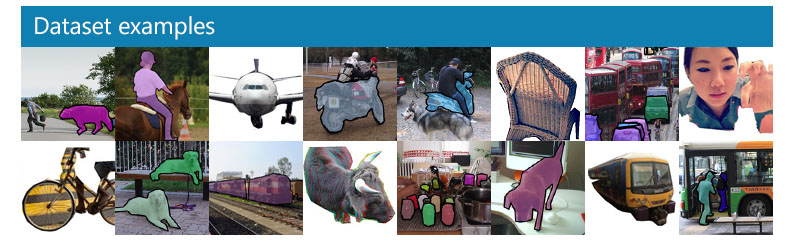
Datasets for Object Detection
- PASCAL VOC - 20 classes
- COCO - Common Objects in Context. 80 classes, boinding boxes + segmentation masks
Object Detection Metrics
Intersection over Union
While for image classification it is easy to measure how well the algorithm performs, for object detection we need to measure both correctness of the class, as well as precision of bounding box location. For the latter, we use so-called Intersection over Union (IoU), which measures how well two boxes (or two arbitrary areas) overlap.

Figure 2 from this excellent blog post on IoU
The idea is simple - we divide the area of intersection between two figures by the area of their union. For two identical areas, IoU would be 1, while for completely disjoint areas it will be 0. Otherwise it will vary from 0 to 1. We typically only consider those bounding boxes for which IoU is over a certain value.
Average Precision
Suppose we want to measure how well a given class of objects C is recognized. To measure it, we use Average Precision metrics, which is calculated as follows.
Consider Precision-Recall curve, which shows the accuracy depending on a detection threshold value (from 0 to 1). Depending on the threshold, we will get more or less objects detected in the image, and different values of precision and recall. The curve will look like this:

Image from NeuroWorkshop
Average Precision for a given class C is the area under this curve. More precisely, Recall axis is typically divided into 10 parts, and Precision is averaged over all those points:
AP = {1\over11}\sum_{i=0}^{10}\mbox{Precision}(\mbox{Recall}={i\over10})
AP and IoU
We shall consider only those detections, for which IoU is above a certain value. For example, in PASCAL VOC dataset typically \mbox{IoU Threshold} = 0.5 is assumed, while in COCO AP is measured for different values of \mbox{IoU Threshold}.

Image from NeuroWorkshop
Mean Average Precision - mAP
The main metrics for Object Detection is called Mean Average Precision, or mAP. It is the value of Average Precision, average across all object classes, and sometimes also over \mbox{IoU Threshold}. In more detail, the process of calculating mAP is described
in this blog post), and also here with code samples.
Different Object Detection Approaches
There are two broad classes of object detection algorithms:
- Region Proposal Networks (R-CNN, Fast R-CNN, Faster R-CNN). The main idea is to generate Regions of Interests (ROI) and run CNN over them, looking for maximum activation. It is a bit similar to the naive approach, with the exception that ROIs are generated in a more clever way. One of the majors drawbacks of such methods is that they are slow, because we need many passes of CNN classifier over the image.
- One-pass (YOLO, SSD, RetinaNet) methods. In those architectures we design the network to predict both classes and ROIs in one pass.
R-CNN: Region-Based CNN
R-CNN uses Selective Search to generate hierarchical structure of ROI regions, which are then passed through CNN feature extractors and SVM-classifiers to determine object class, and linear regression to determine bounding box coordinates. Official Paper

Image from van de Sande et al. ICCV’11

*Images from this blog
F-RCNN - Fast R-CNN
This approach is similar to R-CNN, but regions are defined after convolution layers have been applied.

Image from Offical Paper, arXiv, 2015
Faster R-CNN
The main idea of this approach is to use neural network to predict ROIs - so-called Region Proposal Network. Paper, 2016

Image from the official paper
R-FCN: Region-Based Fully Convolutional Network
This algorithm is even faster than Faster R-CNN. The main idea is the following:
- We extract features using ResNet-101
- Features are processed by Position-Sensitive Score Map. Each object from
Cclasses is divided byk\times kregions, and we are training to predict parts of objects. - For each part from
k\times kregions all networks vote for object classes, and the object class with maximum vote is selected.

Image from official paper
YOLO - You Only Look Once
YOLO is a realtime one-pass algorithm. The main idea is the following:
- Image is divided into
S\times Sregions - For each region, CNN predicts
npossible objects, bounding box coordinates and confidence=probability * IoU.

Image from official paper
- Good blog post describing YOLO
- Official site
- Yolo: Keras implementation, step-by-step notebook
- Yolo v2: Keras implementation, step-by-step notebook
Other Algorithms
- RetinaNet: official paper
- SSD (Single Shot Detector): official paper